What are Infographics?
“It’s a combination of words, numbers, pictures, charts, illustrations, even colors - all in order to describe or explain something quickly, clearly, and in extremely effective and engaging way.
-Infographics For Your Classroom
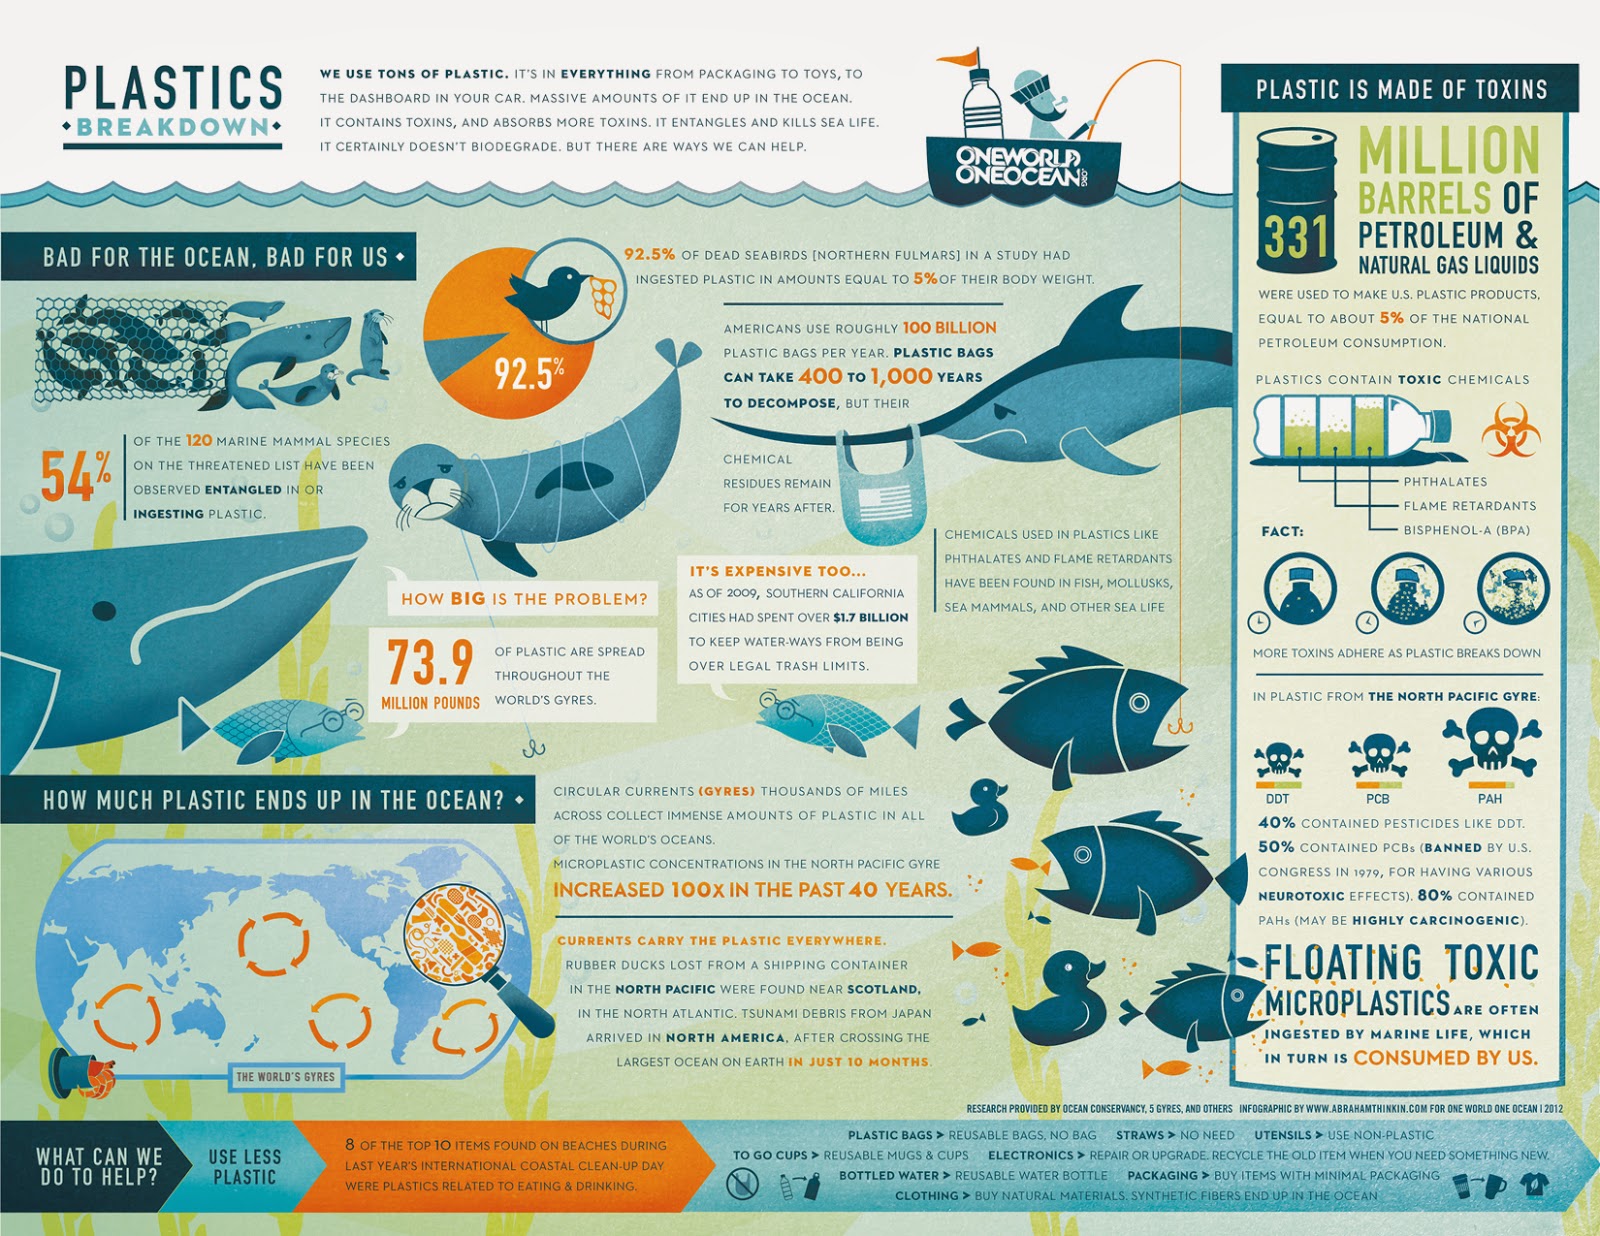
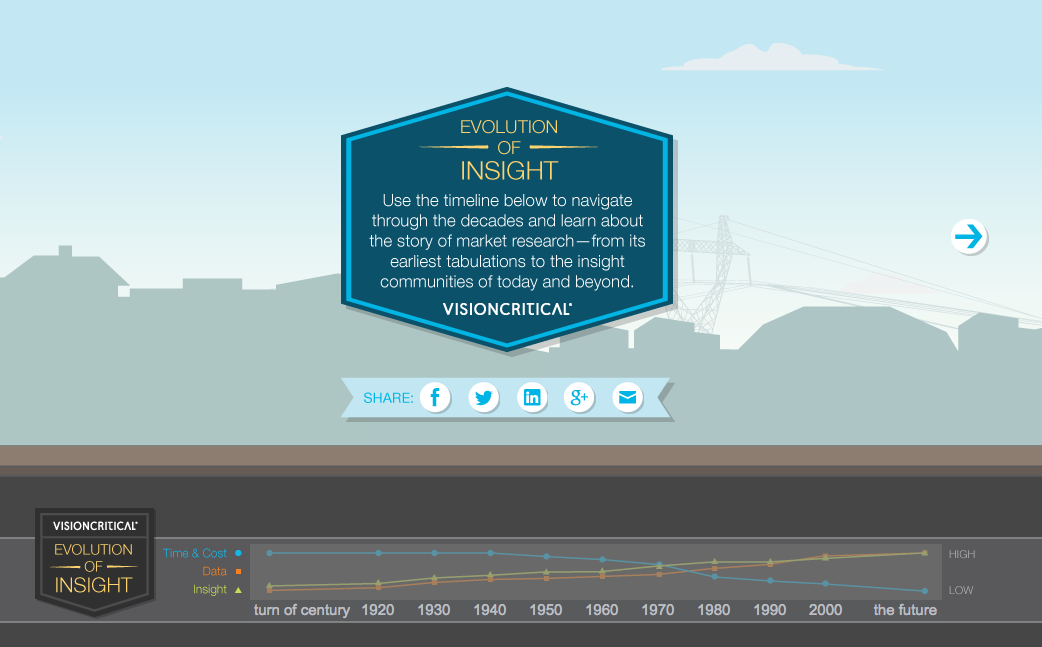
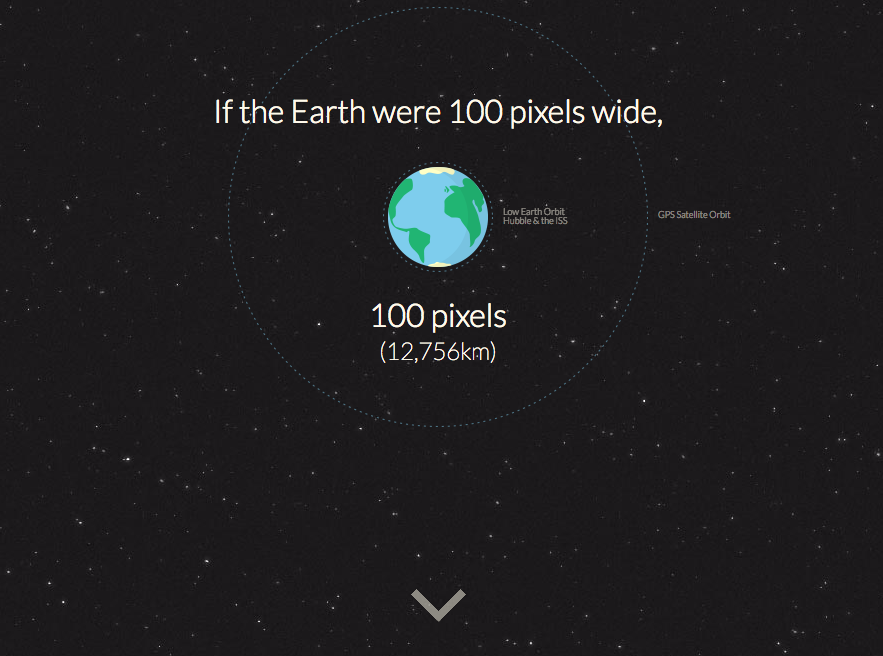
Example Infographics
Static |
Video |
Interactive
|
Animated
|
Share Your Initial Thoughts/Questions/Ideas!
How to Use Infographics with Research
Step 1: Complete Research
- Before starting an infographic, students need to complete research on a topic.
- Students will have more buy in if there is choice in topics or if students create their own research questions.
- Once students have researched, taken notes, cited sources, they can move on to the next phase of sharing information
- Refer to the WHS Research Curriculum Site (it is password protected so if you need the password ask me or the librarians!)
Step 2: What makes an infographic?
- Have students think about two things:
- 1. What is the question you are trying to "answer"
- 2. How do you want to share your information (audience, type of information, mood)
- *Sometimes a graphic organizer can be helpful in students pulling out this information
- Have students look through different samples of infographics
- Planning on paper is helpful to do before starting on the computer
- What Infographics Need: (could be used to develop a rubric)
- A BIG idea………….. What’s the Purpose?
- A central image
- Facts, ideas, important information
- A shocking detail
- Numbers, numbers, numbers
- Creative use of color, image, design and organization
- List of resources at the bottom
Step 3: Create
- Students have different technology skill levels so they can work on infographics at their level (static, interactive, video, animated)
- Several sites available to work through (see below)
- Teacher can set certain criteria for grading (a rubric is helpful) as a guide to students before they begin
Step 4: Sharing of Information
- I do not use the term presenting, because with media often the traditional use of the word is not how I use it!
- I often assign students groups (based on reading levels and project complexity) and have them view a few other students' projects while filling out a questionnaire, note sheet, assessing peers, or having to use information to write a short answer response! (No presenting at all)
- You could have students present in small groups, but the benefit of SHARING either orally or by viewing the work of peers is to:
- 1. Have students review each others' work (not only the teacher seeing it!)
- 2. Provide feedback to students
- 3. All can benefit from the diversity of information and creativity!
- Sometimes having a share out as a whole class can be beneficial after small groups!
Step 5: Assessment
- Provide Rubric ahead of time for students
- Can assess several different things:
- Research Skills--use the WHS school rubric and just copy & paste the parts you want to assess!
- Discipline Content & Understanding
- Group Interactions
- Etc.
- Provide timely feedback to students
| sampleinforubric__1_.doc |
Helpful Links: What the Research Says on Infographics
“Roughly 65 percent of our learners are visual learners”
“Our eyes can register 36,000 visual messages per hour”.
Infographics For Your Classroom Smart Cat Studio
|
“Studies have found that 90 percent of the information that we remember is based on visual impact.” 6 Benefits of Using Infographics Albert Costill Oct 24, 201
|
|
“Reading and writing infographics is like cannonballing into ten feet of water -- you splash in deeper and more quickly”. Inventing Infographics: Visual Literacy meets Written Language Brett Volgelsinger July 16,2014
|
|
“I believe we are on the brink of accepting information and data visualization, illustrated in infographics, as an essential language of proficient readers and writers”. Enhancing Literacy Instruction Through Infographics Mark J. Davis Dec 11, 2015
|
|
“....visualizing information so we can see patterns and connections that matter”......” TED talk, "The Beauty of Data Visualization" David McCandles |
Other Ways to Use Infographics in the Classroom
- ~ Beginning of the year infographic to introduce students or teacher
- ~ School year memory infographic (made by teacher as a gift)
- ~ Student created review infographic to use before a test.
- ~ “Books Read” Infographic
- ~ ”How to” Infographic
- ~ Comparison infographic (two characters, two opinions, two books)
- ~ “Year in review” with current events
- ~ Teacher created lesson infographics (could be interactive)
- ~ Timeline infographic
Information Learned from MassCUE Conference 2016
A special thanks to:
C. Callahan & J. Lowerre from Dale Street Elementary for sharing their knowledge and resources!
A special thanks to:
C. Callahan & J. Lowerre from Dale Street Elementary for sharing their knowledge and resources!